Damped Oscillator Reliability#
import numpy as np
import matplotlib.pyplot as plt
import uqtestfuns as uqtf
The damped oscillator reliability problem is an eight-dimensional reliability analysis test function [DKDS91, Dub11, DKDS90, BDL11].
Note
The reliability analysis variant differs from the base model. The base model computes the mean-square relative displacement of the secondary spring without reference to the performance of the system.
Test function instance#
To create a default instance of the test function:
my_testfun = uqtf.DampedOscillatorReliability()
Check if it has been correctly instantiated:
print(my_testfun)
Function ID      : DampedOscillatorReliability
Input Dimension  : 8 (fixed)
Output Dimension : 1
Parameterized    : True
Description      : Performance function from Der Kiureghian and De Stefano (1990)
Applications     : reliability
Description#
The problem poses the reliability of a damped oscillator system as defined in [IK85] (see Damped Oscillator). The reliability of the system depends on the secondary spring as described by the following performance function [Dub11, DKDS90] [1]:
where \(\boldsymbol{x} = \{ M_p, M_s, K_p, K_s, \zeta_p, \zeta_s, S_0, F_s \}\) is the eight-dimensional vector of input variables probabilistically defined further below and \(p\) is a deterministic parameter of the function (i.e., the peak factor).
The failure state and the failure probability are defined as \(g(\boldsymbol{x}; p) \leq 0\) and \(\mathbb{P}[g(\boldsymbol{X}; p) \leq 0]\), respectively.
Probabilistic input#
Based on [DKDS91], the probabilistic input model for the damped oscillator reliability consists of eight independent random variables with marginal distributions shown in the table below.
Function ID     : DampedOscillatorReliability
Input ID        : DerKiureghian1990a
Input Dimension : 8
Description     : Input model #1 for the damped oscillator reliability from
                  Der Kiureghian and De Stefano (1990)
Marginals       :

 No.    Name    Distribution          Parameters                       Description
-----  ------  --------------  -------------------------  --------------------------------------
  1      Mp      lognormal      [0.40048994 0.09975135]                Primary mass
  2      Ms      lognormal     [-4.61014535  0.09975135]              Secondary mass
  3      Kp      lognormal     [-0.01961036  0.1980422 ]         Primary spring stiffness
  4      Ks      lognormal     [-4.62478054  0.1980422 ]        Secondary spring stiffness
  5    Zeta_p    lognormal     [-3.06994228  0.38525317]          Primary damping ratio
  6    Zeta_s    lognormal     [-4.02359478  0.47238073]         Secondary damping ratio
  7      S0      lognormal      [4.60019502 0.09975135]       White noise base acceleration
  8      Fs      lognormal      [2.70307504 0.09975135]   Force capacity of the secondary spring

Copulas         : Independence
In the literature, the force capacity of the secondary spring (i.e., \(F_s\)) have different probabilistic specifications as summarized in the table below.
\(F_S\) |
Keyword |
Source |
|---|---|---|
\(\mathcal{N}_{\mathrm{log}}(15.0, 1.50)\) |
|
[DKDS90] |
\(\mathcal{N}_{\mathrm{log}}(21.5, 2.15)\) |
|
[DKDS90] |
\(\mathcal{N}_{\mathrm{log}}(27.5, 2.75)\) |
|
[DKDS90] |
Note that the parameters of the log-normal distribution given above correspond to the mean and standard deviation of the log-normal distribution (and not the mean and standard deviation of the underlying normal distribution).
With the higher mean of \(F_s\), the failure probability becomes smaller.
Parameters#
The performance function contains a single parameter whose default value is shown below [DKDS91].
Function ID  : DampedOscillatorReliability
Parameter ID : DerKiureghian1990
Description  : Parameter set for the damped oscillator reliability
               problem from Der Kiureghian and De Stefano (1990)

 No.    Keyword      Value      Type     Description
-----  ---------  -----------  ------  ---------------
  1       pf      3.00000e+00  float   Peak factor [-]
Reference results#
This section provides several reference results of typical UQ analyses involving the test function.
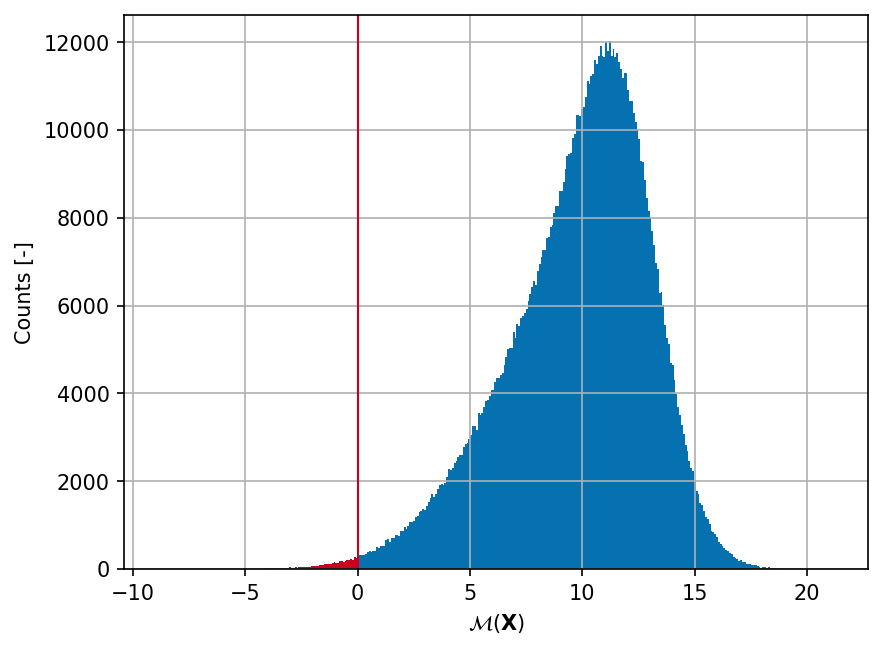
Sample histogram#
Shown below is the histogram of the output based on \(10^6\) random points:
Failure probability#
Some reference values for the failure probability \(P_f\) and from the literature are summarized in the table below (\(\mu_{F_s}\) is the log-normal distribution mean of \(F_s\)).
\(\mu_{F_s}\) |
Method |
\(N\) |
\(\hat{P}_f\) |
\(\mathrm{CoV}[\hat{P}_f]\) |
Source |
|---|---|---|---|---|---|
\(15\) |
\(1'179\) |
\(2.19 \times 10^{-2}\) |
— |
||
\(3 \times 10^5\) |
\(4.63 \times 10^{-3}\) |
\(< 3\%\) |
[Dub11] |
||
Meta-IS[2] |
\(464 + 600\) |
\(4.80 \times 10^{-3}\) |
\(< 5\%\) |
[Dub11] |
|
\(1'719\) |
\(4.78 \times 10^{-3}\) |
\(< 4\%\) |
[BDL11] |
||
\(21.5\) |
\(2'520\) |
\(3.50 \times 10^{-4}\) |
— |
||
\(5 \times 10^5\) |
\(4.75 \times 10^{-5}\) |
\(< 4\%\) |
[Dub11] |
||
Meta-IS |
\(336 + 400\) |
\(4.46 \times 10^{-5}\) |
\(< 5\%\) |
[Dub11] |
|
\(2'865\) |
\(4.42 \times 10^{-5}\) |
\(< 7\%\) |
[BDL11] |
||
\(27.5\) |
\(2'727\) |
\(3.91 \times 10^{-6}\) |
— |
||
\(7 \times 10^5\) |
\(3.47 \times 10^{-7}\) |
\(< 5\%\) |
[Dub11] |
||
Meta-IS |
\(480 + 200\) |
\(3.76 \times 10^{-7}\) |
\(< 5\%\) |
[Dub11] |
|
\(4'011\) |
\(3.66 \times 10^{-7}\) |
\(< 10\%\) |
[BDL11] |
Note that in the table above the total number of model evaluations for metamodel-based Importance Sampling (Meta-IS) is the sum of training runs and the correction runs [Dub11].
References#
Takeru Igusa and Armen Der Kiureghian. Dynamic characterization of two-degree-of-freedom equipment-structure systems. Journal of Engineering Mechanics, 111(1):1–19, 1985. doi:10.1061/(asce)0733-9399(1985)111:1(1).
Armen Der Kiureghian and Mario De Stefano. Efficient algorithm for second-order reliability analysis. Journal of Engineering Mechanics, 117(12):2904–2923, 1991. doi:10.1061/(asce)0733-9399(1991)117:12(2904).
Vincent Dubourg. Adaptive surrogate models for reliability analysis and reliability-based design optimization. phdthesis, Université Blaise Pascal - Clermont II, Clermont-Ferrand, France, 2011.