Genz Continuous Function#
import numpy as np
import matplotlib.pyplot as plt
import uqtestfuns as uqtf
The Genz continuous function is an \(M\)-dimensional scalar-valued function commonly used to assess the accuracy of numerical integration routines. It is one of six functions introduced by Genz [Gen84]; see the box below.
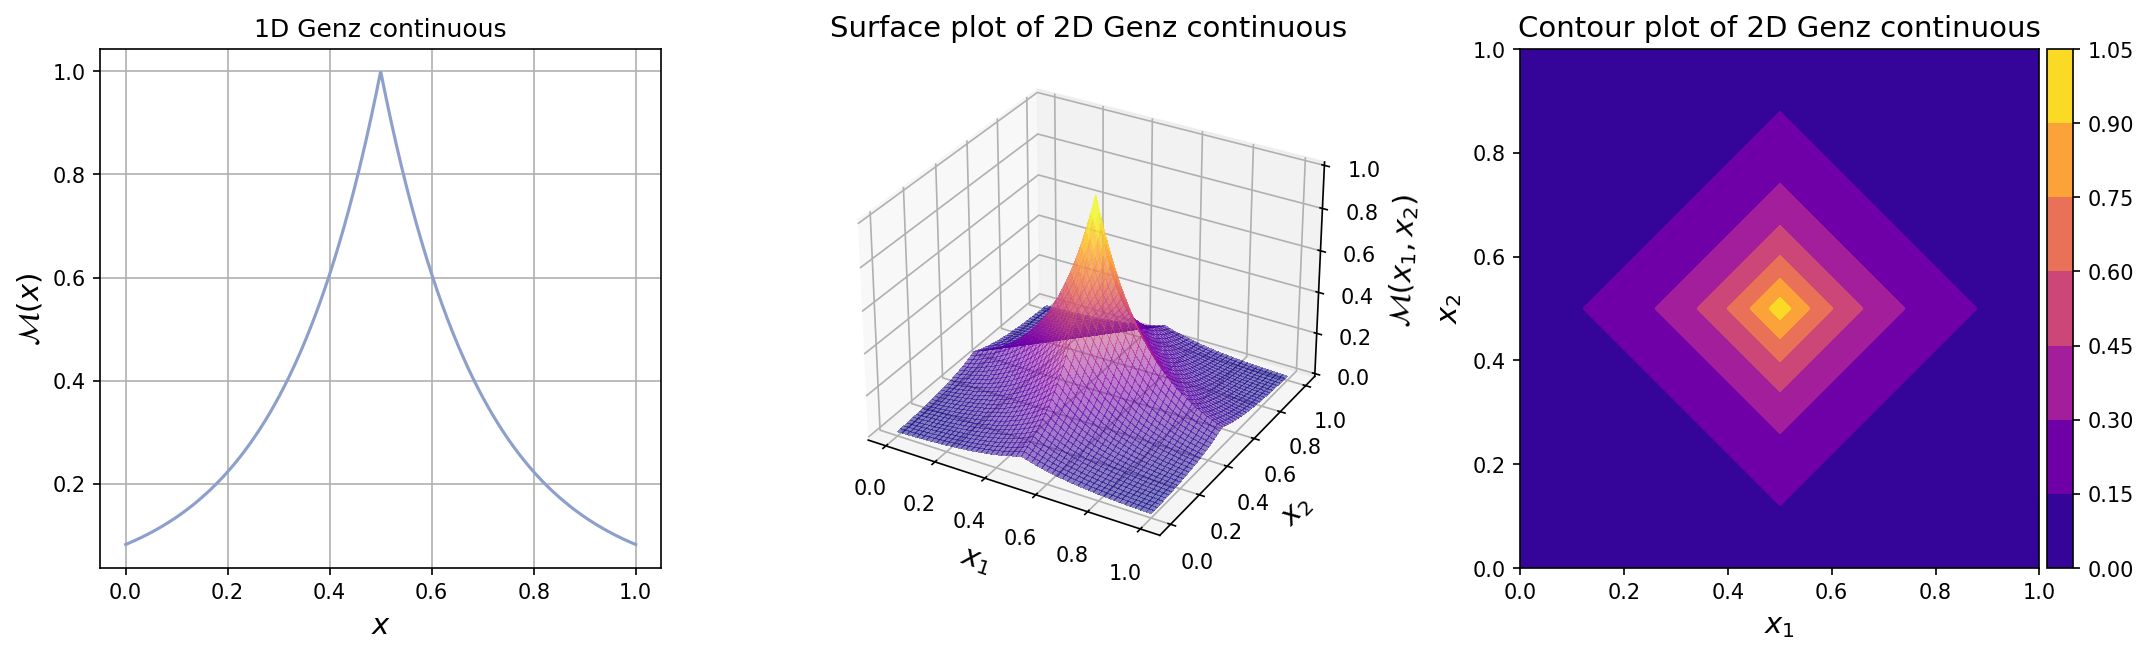
The function features an exponential decay from the center of the multidimensional space. The function is continuous everywhere, but non-differentiable at the center. The plots for one-dimensional and two-dimensional Genz continuous function with the default parameters can be seen below.
Note
Genz [Gen84] introduced six challenging parameterized \(M\)-dimensional functions designed to test the performance of numerical integration routines:
Oscillatory function features an oscillating shape in the multidimensional space.
Product peak function features a prominent peak at the center of the multidimensional space.
Corner peak function features a prominent peak in one corner of the multidimensional space.
Gaussian function features a bell-shaped peak at the center of the multidimensional space.
Continuous function features an exponential decay from the center of the multidimensional space. The function is continuous everywhere, but non-differentiable at the center. (this function)
Discontinuous function features an exponential rise from corner of the multidimensional space up to the offset parameter value, after which the function value drops to zero everywhere, creating discontinuity.
The functions are further characterized by offset (shift) and shape parameters. While the offset parameter has minimal impact on the integral’s value, the shape parameter significantly affects the difficulty of the integration problem.
Test function instance#
To create a default instance of the test function:
my_testfun = uqtf.GenzContinuous()
Check if it has been correctly instantiated:
print(my_testfun)
Function ID      : GenzContinuous
Input Dimension  : 2 (variable)
Output Dimension : 1
Parameterized    : True
Description      : Continuous (but non-differentiable) integrand from Genz (1984)
Applications     : integration
By default, the input dimension is set to \(2\)[1].
To create an instance with another value of input dimension,
pass an integer to the parameter input_dimension (the first parameter).
For example, to create an instance of the test function in six dimensions,
type:
my_testfun = uqtf.GenzContinuous(input_dimension=6)
Description#
The Genz continuous is defined as:
where \(\boldsymbol{x} = \left( x_1, \ldots, x_M \right)\) is the \(M\)-dimensional vector of input variables; and \(\boldsymbol{a} = \left( a_1, \ldots, a_M \right)\) \(\boldsymbol{b} = \left( b_1, \ldots, b_M \right)\) are \(M\)-dimensional vectors corresponding to the (fixed) shape and offset parameters, respectively. Further details about these parameters are provided below.
Probabilistic input#
The input specification for the Genz continuous function is shown below.
Show code cell source
print(my_testfun.prob_input)
Function ID     : GenzContinuous
Input ID        : Genz1984
Input Dimension : 2
Description     : Input specification for the Genz family of integrand
Marginals       :

 No.    Name    Distribution    Parameters    Description
-----  ------  --------------  ------------  -------------
  1      X1       uniform        [0. 1.]           -
  2      X2       uniform        [0. 1.]           -

Copulas         : Independence
Parameters#
The parameters of the Genz corner peak function consists of the vector of shape (scale) parameters \(\boldsymbol{a}\) and the vector of offset parameters \(\boldsymbol{b}\).
The shape parameters determines the extent of the product peaking; Larger values of \(\boldsymbol{a}\) increase the prominence of the peak, making the integration problem more challenging. The offset parameters, on the other hand, do not affect significantly the difficulty of the problem and can be chosen randomly.
The default parameter is shown below.
Show code cell source
print(my_testfun.parameters)
Function ID  : GenzContinuous
Parameter ID : Genz1984
Description  : Parameter set for the continuous function from Genz
               (1984); constant shape and offset values

 No.    Keyword     Value      Type      Description
-----  ---------  ----------  -------  ----------------
  1       aa      (2,) array  ndarray  Shape parameter
  2       bb      (2,) array  ndarray  Offset parameter
Reference results#
This section provides several reference results of typical UQ analyses involving the test function.
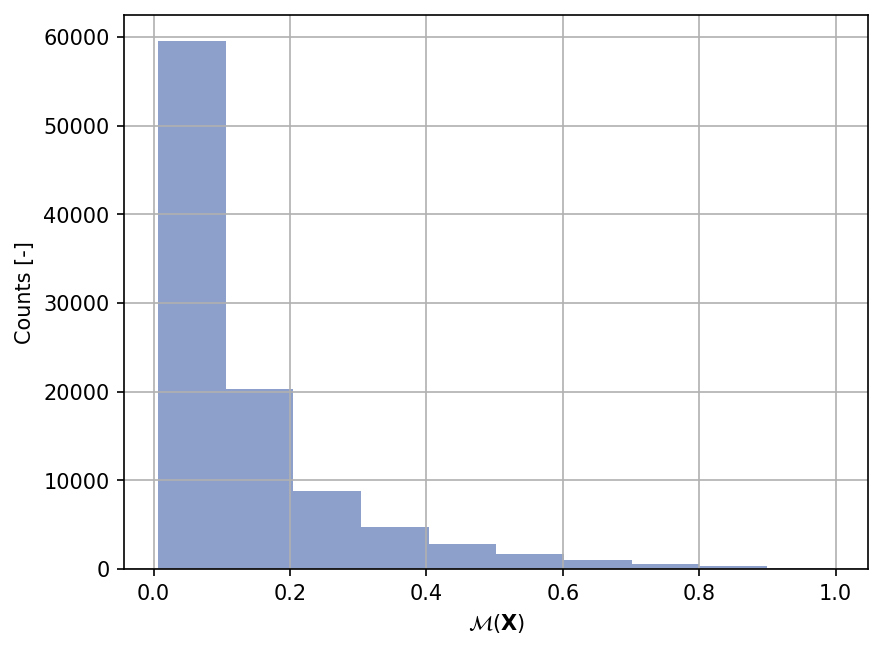
Sample histogram#
Shown below is the histogram of the output based on \(100'000\) random points:
Show code cell source
my_testfun.prob_input.reset_rng(42)
xx_test = my_testfun.prob_input.get_sample(100000)
yy_test = my_testfun(xx_test)

plt.hist(yy_test, color="#8da0cb");
plt.grid();
plt.ylabel("Counts [-]");
plt.xlabel("$\mathcal{M}(\mathbf{X})$");
plt.gcf().set_dpi(150);